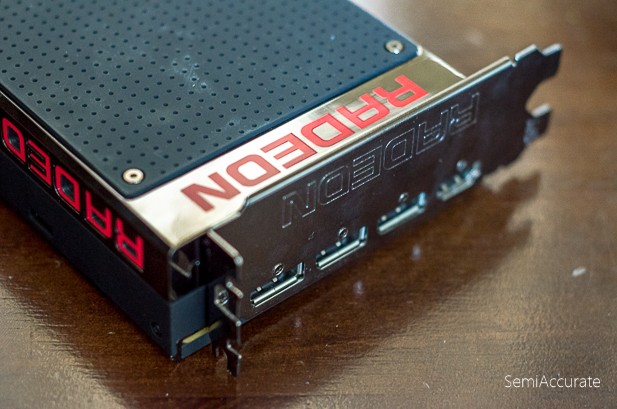
 With an almost 600m2 die AMD’s R9 Fury X looks to have excellent OpenCL compute potential. In this article we’ll take a look and see how Fiji performs in a variety of OpenCL benchmarks. With 8.6 TFLOPS of single precision compute on tap and half a terabyte of memory bandwidth to back it up the Fury X should put up some impressive numbers in our benchmarks. In gaming scenarios, we found that it was about 50 percent faster than AMD’s old flagship the R9 290X. We expect to similar results in this comparison.
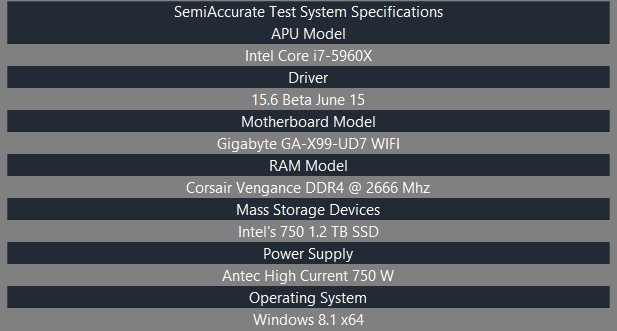 Our test setup is the same as in our gaming focused articles. You can once again find our raw testing data on OneDrive. Our testing bits were provided by the usual suspects and our R9 Fury X and R9 290X were shipped to us straight from ATI Technologies in Taiwan. (Check it out, they never changed their name after the acquisition.)
First let’s start with the bad news, or at least the most unimpressive thing about the compute performance of the Fury X: double precision compute. AMD quotes compute performance as up to 8.6 TFLOPS: that is single precision of course. Double precision compute appears to limited to 1/16th of the rate of single precision compute. 8600 GFLOPS / 16 GFLOPS = 537.5 GFLOPS with that in mind the following results should be unsurprising.
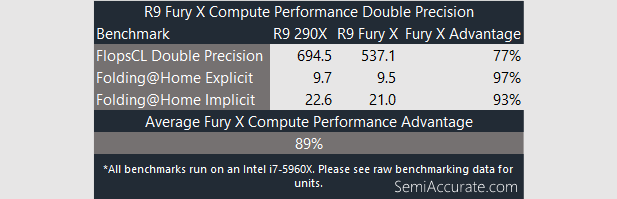
In double precision compute tasks the R9 290X is just as fast, if not slightly faster than AMD’s brand new Fury X. In raw double precision GFLOPS the difference is a significant 157.4 GFLOPS in favor of AMD’s old stalwart. In Folding@Home this gap appears much smaller though with the R9 290X just barely edging the R9 Fury X out. We’d attribute the difference between potential performance and real-world performance in this case to the increased amount of cache found in R9 Fury X over the R9 290X which went from 1 MB to 2 MBs.
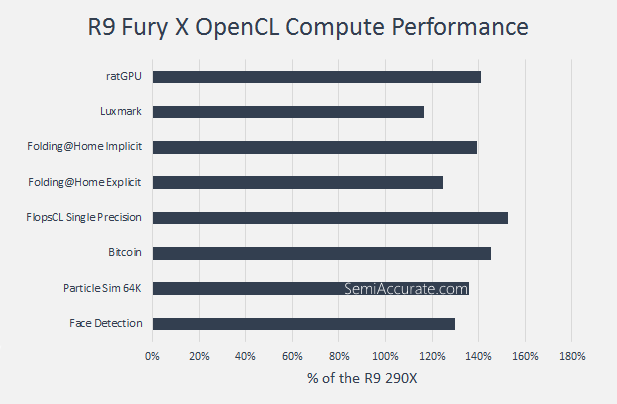
Moving to single precision compute tests the R9 Fury X shows it potential consistently out performs the R9 290X by 37 percent on average.
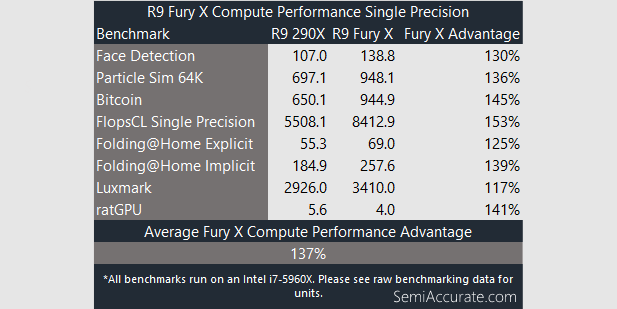
Here’s those same numbers in table format.
Just to keep AMD honest our FlopsCL benchmark shows that the R9 Fury X is, for whatever reason, capable of up to only 8.4 TFLOPS rather than the 8.6 TFLOPS that basic math, and AMD’s spec sheet, would lead us to assume should be capable of.
Overall we can see that AMD has improved compute performance with Fiji. The performance gains in this area are not as large as they are in gaming tasks. But they are still substantial and it appears that the larger caches in Fiji allow it to come closer to its theoretical potential in both real world and synthetic benchmarks than Hawaii could.S|A
Thomas Ryan
Latest posts by Thomas Ryan (see all)
- Intel’s Core i7-8700K: A Review - Oct 5, 2017
- Raijintek’s Thetis Window: A Case Review - Sep 28, 2017
- Intel’s Core i9-7980XE: A Review - Sep 25, 2017
- AMD’s Ryzen Pro and Ryzen Threadripper 1900X Come to Market - Aug 31, 2017
- Intel’s Core i9-7900X: A Review - Aug 24, 2017