![]() A few weeks ago, Nuvia announced their new Phoenix ARM CPU core and Orion SoC with some interesting numbers. The claims that Nuvia is making about the state of server CPUs shows a clear difference in performance that differentiates ARM and x86 cores.
A few weeks ago, Nuvia announced their new Phoenix ARM CPU core and Orion SoC with some interesting numbers. The claims that Nuvia is making about the state of server CPUs shows a clear difference in performance that differentiates ARM and x86 cores.
As with all complex data sets that are reduced to a single set of numbers, things often require parsing. SemiAccurate has been thinking a lot about the numbers Nuvia presented and has come to one conclusion, they are right. Sort of, but they definitely are not wrong. Lets start out with the raw data.
How the cores perform
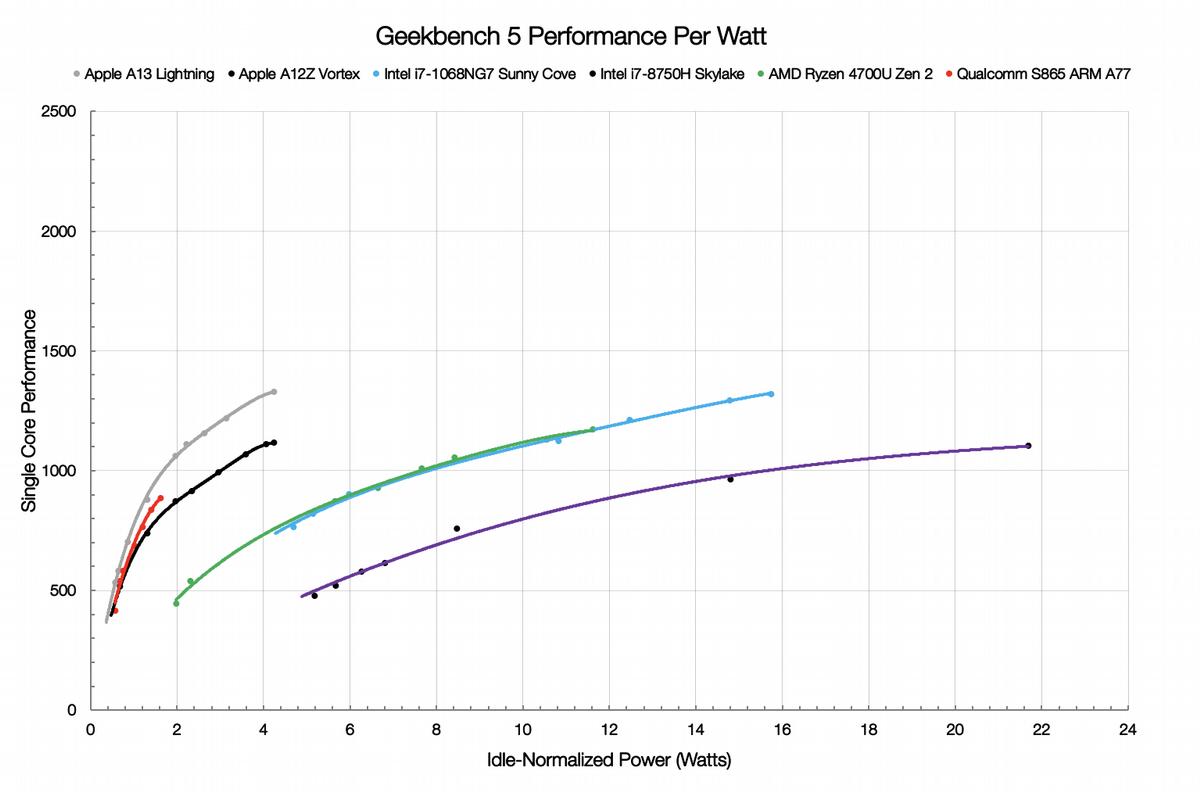
Nuvia compared the current best of AMD, Zen 2, to the latest Intel, 14nm and 10nm *Lake, and all against three ARM variants, two Apple and one Qualcomm. The only benchmark used was Geekbench 5 which was chosen for it’s cross-platform availability and breadth of testing. It is unquestionably not a server benchmark but Nuvia is not comparing server SoCs, just looking at core performance and efficiency. For this you can consider Geekbench 5 to be a decent proxy for SpecINT, and besides, uncore performance is mostly core agnostic.
The first thing most critics will attack on tests like this is that the systems tested were pretty disparate and uncore power draw of the SoC/CPU can make any measurements laughably inaccurate if not done correctly. Then they will point out that the systems in question themselves range from phones to laptops so the device itself affects how things are measured, and then there is power delivery efficiency and cooling. In short you can’t isolate the SoC power draw from the rest of the system, and even if you could, you can’t isolate the core power from the rest of the SoC itself.
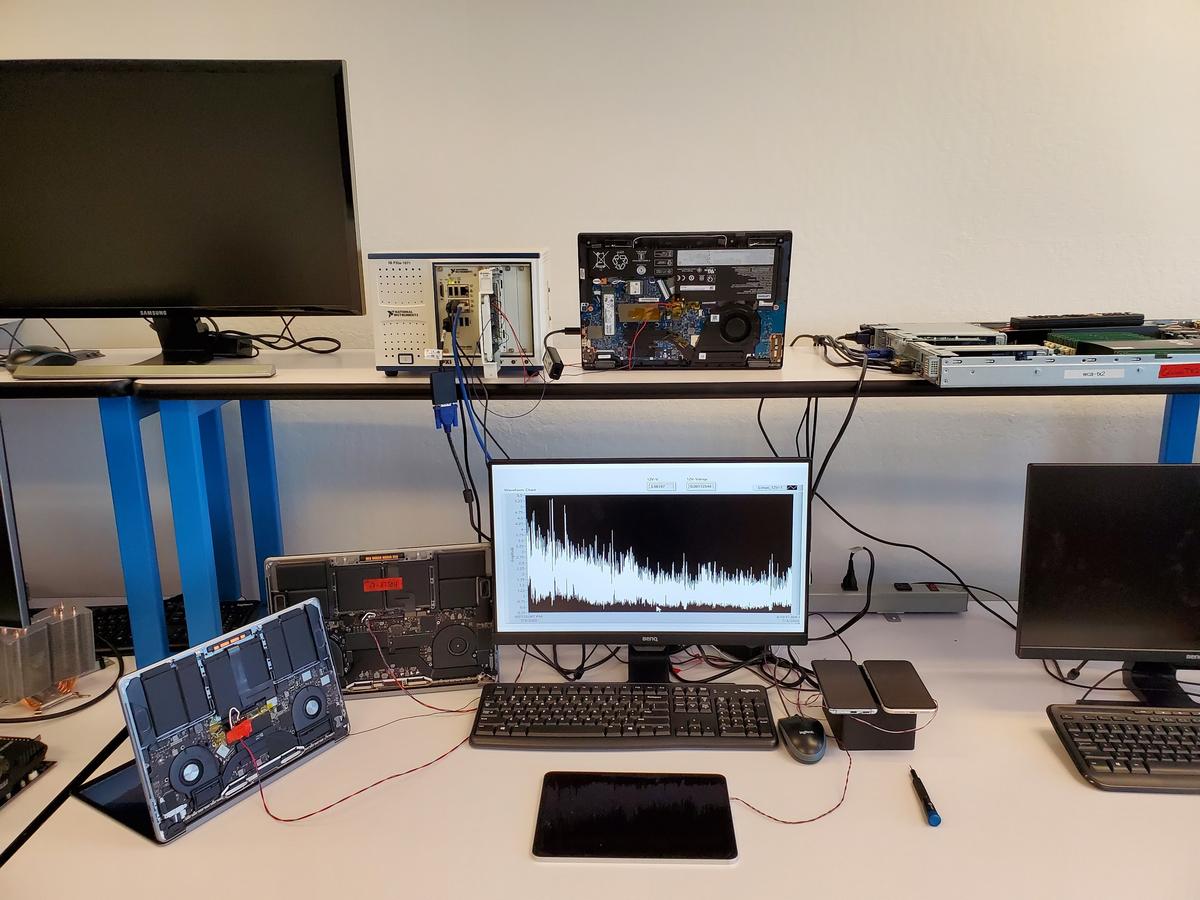
Testing power the hard way
Actually you can do most of that if you spend the time and effort as Nuvia obviously did. Toss in that several of the people at the company were involved with the design and manufacture of a few of the chips in question and it is a safe bet that those instrumenting the devices actually knew what they were doing. This is the long way of saying that the results Nuvia published may not be perfect but they are likely as close as you are going to get in the real world.
Geekbench 5 comes under quite a lot of criticism from various parties but we will not wade into that here. Whether or not you like it, it is consistent across most devices even if the cache games handicap the older Apple and Qualcomm CPUs. If you feel that the benchmark is not fair, ignore the A12 and Qualcomm numbers but the rest are in the right ballpark. In any case Geekbench 5 is not a server benchmark and should not be used to measure server CPU/SoC performance, but Nuvia is not doing that here. In short these numbers are likely representative of what they claim, core performance, just don’t extrapolate that to future server system performance directly, it may or may not follow the same path.
One last thing to take in to account is clocks. The higher you clock a CPU, the less efficient it will be overall, mostly, with some big caveats. The tradeoff is absolute peak single threaded performance for efficiency further down the curve. This is a design choice and one that is very different for consumer PCs, servers, and mobile devices. You can see this in the curves Nuvia presented, and if a server CPU was tested, it would likely be even more extreme than the PC cores.
Going back to the data we see that the best ARM core, the custom Apple A13 Lightning is about as high performance as the best x86 core, in this case the Intel Ice Lake i7-1068NG7. The point that Nuvia is trying to make though is that it does this while using about 30% of the power, a bit over 4W/core for the A13, a little less than 16W for Ice. Before you point out that the Intel CPU uses more memory channels, higher power memory, and all the rest, that energy use was filtered out earlier, remember? Just like AMD’s massive advantage in performance per Watt we told you about earlier, ARM cores seem to have a similar advantage over their x86 brethren.
We are not going to dive in to the weeds here and try to tease out why each ISA implementation clusters around a given PPW (Performance Per Watt) . There are lots of reasons that go above and beyond ISA efficiency like process choice, process variant on a given node, frequency scaling targets, and much more. Lets just agree that of the tested x86 parts, ARM ISA cores trounce x86 ISA cores. That said if you look at what is possible, AMD’s 225W Epyc 7742 64C CPU pulls ~3.5W/core and the 64C 7702 uses 200W for ~3.13W/core, all of this inclusive of the uncore. They have lower peak turbo clocks than the ARM chips listed above, but we have no idea how much energy one of those cores can pull at peak turbo or what they score on Geekbench 5, just pointing out that these numbers are in the range of what x86 cores can do as well.
Back to the story at hand, this is about a core, not a server SoC with many cores. As we stated earlier these numbers are not directly comparable to a server SoC, there are a lot of other variables that may allow them to achieve their best or fall flat on their face. So what do single core PPW numbers mean in that arena? Quite simple actually, energy use shows how many cores you can pack in to a given TDP, typically ~250W for high end server parts of late, and the performance shows the upper bound of what you can get for it as long as the uncore does not limit the scaling.
As Nuvia rightly points out, a modern server is a pretty highly loaded device with cores running as fast as they can up to the TDP limit. When that limit is hit, momentary overshooting via turbo mechanisms notwithstanding, that is where you sit. The numbers Nuvia presented basically show this very common steady state performance ceiling for servers. Assuming the rest of the system (uncore) is the same, you can pack in nearly 4x as many ARM Apple A13 cores as you can Ice Lake ones. As long as you aren’t memory bound, you will hit ~4x the performance or conversely you can run at the same performance with ~1/4 the energy use. This matters a lot to the hyperscalers, in fact running costs are likely as important as purchase costs to the tier-1 crowd.
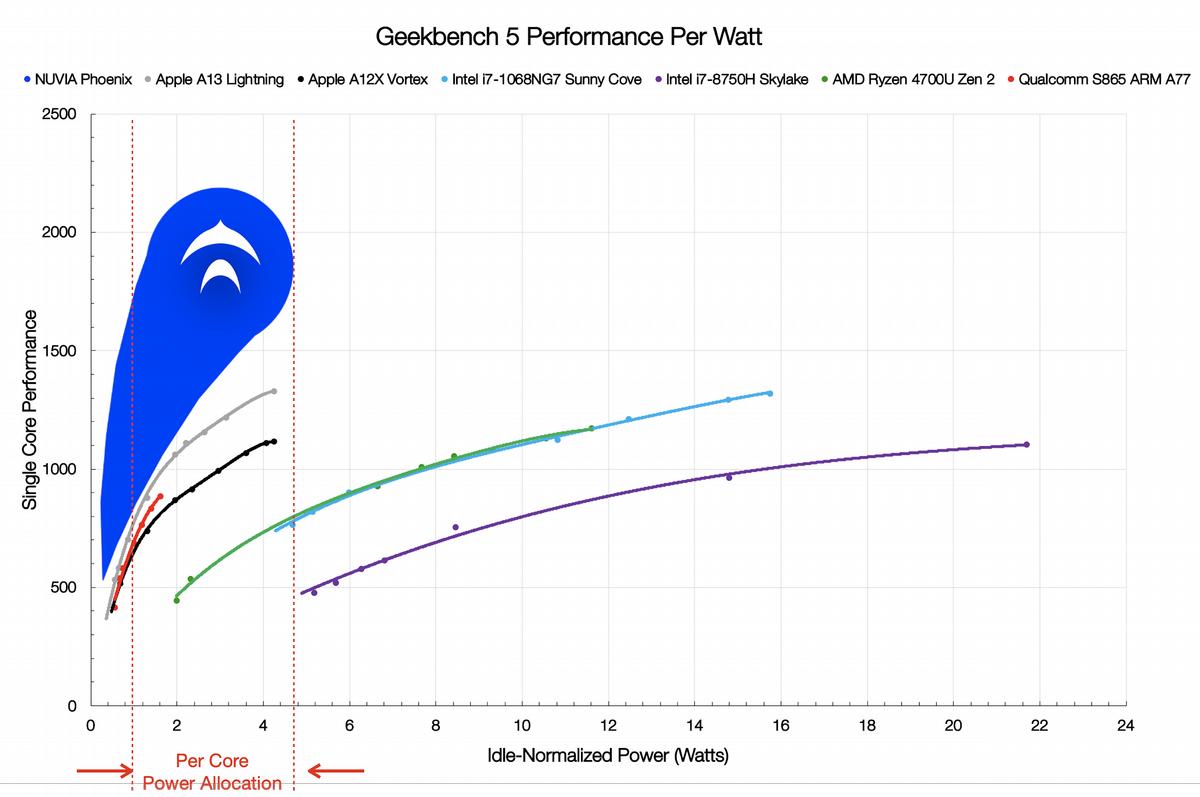
Core performance with Nuvia’s Phoenix
With their projections for the Phoenix ARM core, Nuvia is claiming a performance per Watt advantage over the current core offerings from Apple, Qualcomm, Intel, and AMD. The numbers support that and do show ARM is more efficient in doing the tasks at hand, in this case Geekbench 5. The key engineers at Nuvia has a long track record of pushing the boundaries of core performance and efficiency as well as interesting uncore work as well. SemiAccurate is willing to give them the benefit of the doubt on the performance of the SoC itself.
In the end, Nuvia is claiming a massive advantage on core performance, something that is in the range of the numbers ARM recently revealed. There is a long way to go before we have proof of what Nuvia is claiming, rumors are that Orion will tape out in 2021 so you likely won’t have silicon sampling until 2022. Given the pedigree of the core engineers at the company, SemiAccurate is cautiously optimistic about both their claims of core performance and the uncore not standing in the way.S|A
Charlie Demerjian
Latest posts by Charlie Demerjian (see all)
- AMD outs MI300 plans… sort of - Apr 11, 2024
- Qualcomm is planning a lot of Nuvia/X-Elite announcements - Mar 25, 2024
- Why is there an Altera FPGA on QTS Birch Stream boards? - Mar 12, 2024
- Doogee (Almost) makes the phone we always wanted - Mar 11, 2024
- Intel Birch Stream Boards Speak From The SIde - Mar 6, 2024